Before diving into complex genomic analysis, how do we ensure the very foundation—our extracted DNA—is both sufficient in quantity and pure enough for reliable results?
In metagenomics, the quality and quantity of your extracted DNA are paramount. Just like a chef needs the right ingredients in the right amounts, a molecular biologist needs precise DNA measurements. This lesson will equip you with the knowledge to accurately quantify your DNA and assess its purity using spectrophotometry, primarily with the NanoDrop system, ensuring your samples are truly ready for downstream applications.
LEARNING OUTCOMES
- Explain what OD260 measures.
- Calculate dsDNA concentration from absorbance.
- Interpret the 260/280 ratio as a purity indicator.
- Understand why contamination affects quantitation.
COURSE READING
DNA QUANTITATION — Spectrophotometry and Nanodrop
Understanding DNA Quantitation: The Role of Spectrophotometry
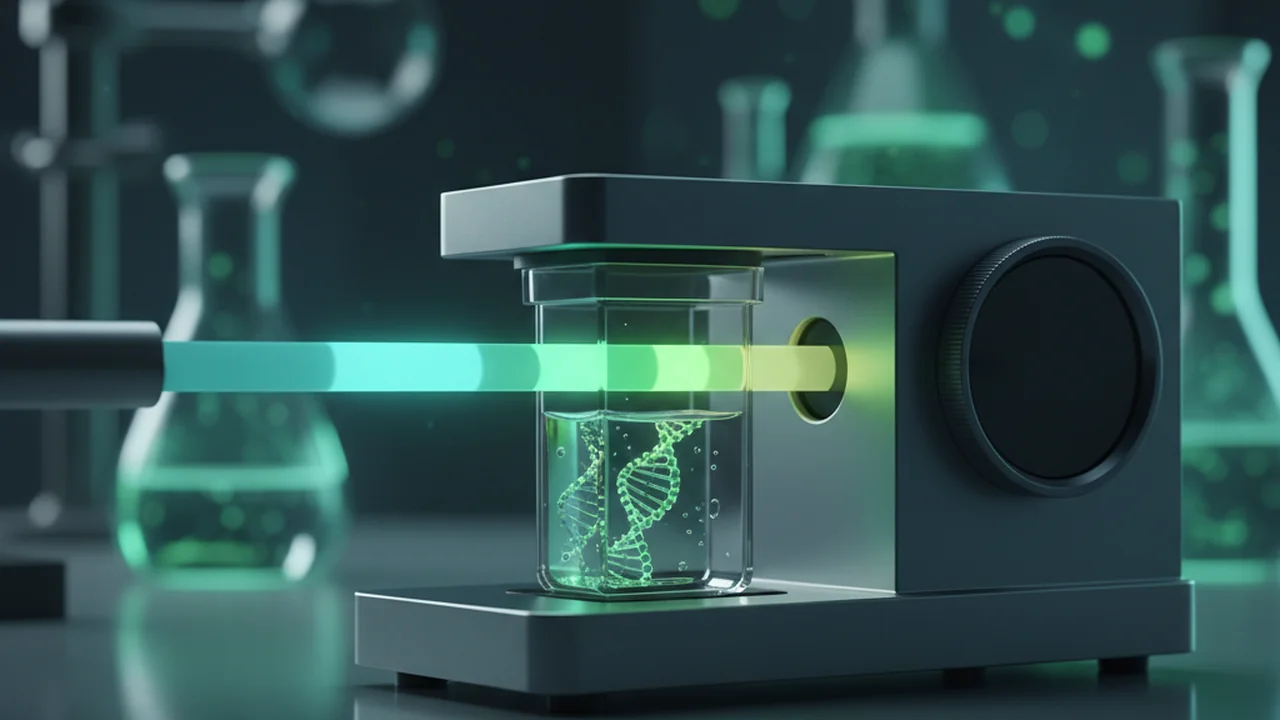
Spectrophotometry is a fundamental technique used to measure the concentration of nucleic acids (DNA and RNA) and proteins in a solution. It works by measuring the amount of light absorbed by a sample at specific wavelengths. For DNA, the critical wavelength is 260 nm.
Optical Density at 260 nm. This measurement directly correlates with the concentration of nucleic acids (DNA and RNA) in a sample, as these molecules absorb UV light most strongly at this wavelength.
The principle behind spectrophotometry is the Beer-Lambert Law, which states that the absorbance of a solution is directly proportional to the concentration of the absorbing substance and the path length of the light through the solution. The NanoDrop system utilizes a very short path length (often 1mm or less) to allow for measurement of highly concentrated samples without dilution.
Optical Density Reference Values (OD260 = 1.0):
An OD260 reading of 1.0 corresponds to the following concentrations for different nucleic acid types:
- dsDNA: 50 µg/ml
- ssDNA: 33 µg/ml
- Oligonucleotide: 20–30 µg/ml
- RNA: 40 µg/ml
These reference values are crucial for converting raw absorbance readings into actual concentrations. For metagenomics, we are typically interested in double-stranded DNA (dsDNA).
Consider a scenario where your sample contains a mix of dsDNA and ssDNA. How might this affect your calculated total DNA concentration if you only assume dsDNA?
Assessing DNA Purity: The 260/280 Ratio
Beyond just quantity, the purity of your DNA sample is equally vital. Contaminants like proteins, phenol, and guanidine salts can interfere with downstream enzymatic reactions (PCR, sequencing) and lead to inaccurate results. The 260/280 ratio is a standard metric for assessing nucleic acid purity.
The ratio of absorbance at 260 nm to absorbance at 280 nm. This ratio is used to assess the purity of nucleic acid samples, indicating the presence of protein or phenol contamination.
Any 260/280 ratio outside the “perfect” range means your DNA is completely unusable.
While an ideal ratio is preferred, the acceptable range can vary depending on the downstream application. Some applications are more tolerant of minor contamination than others, but significant deviation usually warrants further purification.
Purity Assessment (OD260/OD280 ratio):
- Pure DNA: ~1.8
- Pure RNA: ~2.0
- Low ratios indicate protein or phenol contamination
A lower than ideal ratio (e.g., 1.5) suggests the presence of proteins, which absorb strongly at 280 nm. Phenol, often used in extraction protocols, also absorbs at 270 nm, which can depress the 260/280 ratio.
Want to go deeper? The science behind 260/280 ratios…
The different wavelengths are absorbed by different components: DNA and RNA absorb maximally at 260 nm due to their nitrogenous bases, while proteins (specifically, aromatic amino acids like tryptophan and tyrosine) absorb maximally at 280 nm. Phenol, a common contaminant from DNA extraction, also absorbs significantly around 270 nm. Therefore, a low 260/280 ratio indicates higher relative absorbance at 280 nm, pointing to protein or phenol contamination. A high ratio can sometimes indicate RNA contamination, or even buffer issues.
- We’ve learned how OD260 measures DNA concentration.
- We’ve understood how the 260/280 ratio indicates DNA purity.
- We’ve identified common contaminants that affect these measurements.
Putting it into Practice: Calculation and Nanodrop Use
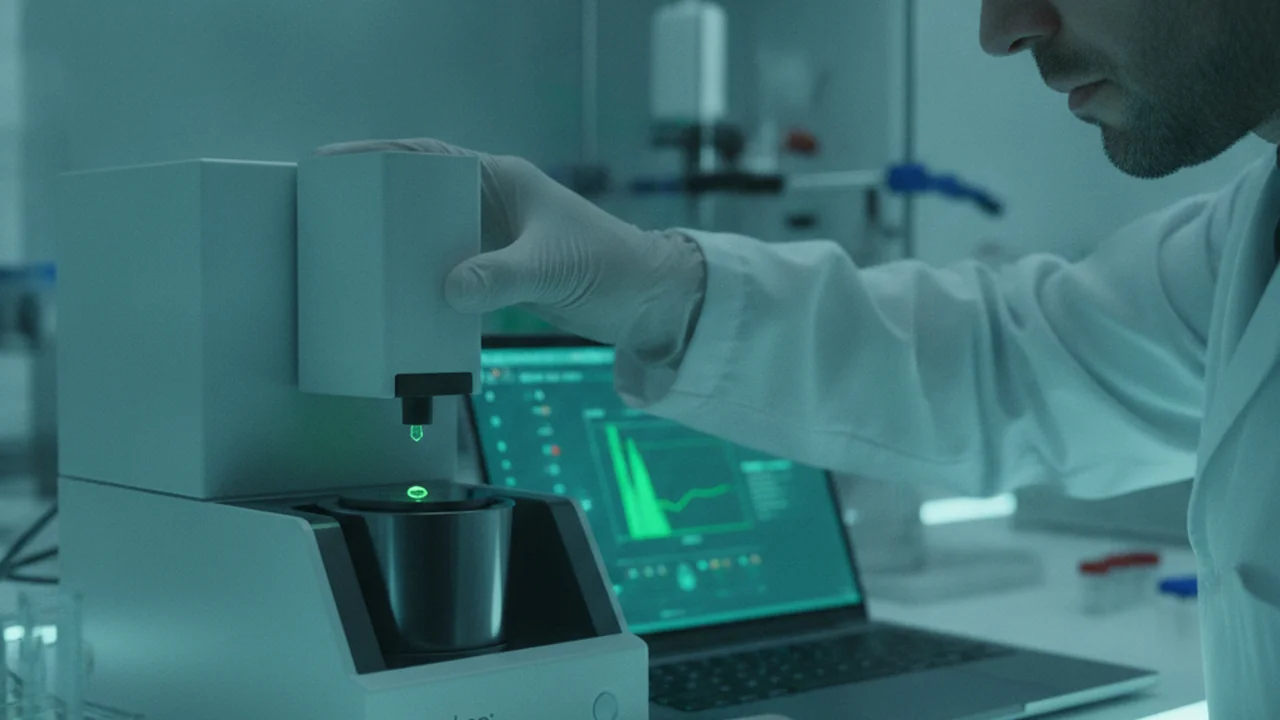
Now, let’s look at a practical example of calculating dsDNA concentration from an OD260 reading.
Example Calculation:
Sample reading at OD260 = 0.65
dsDNA concentration = 50 µg/ml × 0.65 = 32.5 µg/ml
Conversion: 32.5 µg/ml = 32.5 ng/µl
Imagine you’ve just run a NanoDrop analysis on a new metagenomic sample. Use the provided reference values to calculate its concentration and assess its purity.
- A NanoDrop reading for a dsDNA sample gives an OD260 of 0.82. Calculate the dsDNA concentration in µg/ml and ng/µl.
- The same sample has a 260/280 ratio of 1.6. What does this indicate about the sample’s purity?
- If your next step is sensitive to contaminants, what might be your course of action?
You will use the NanoDrop 2000 for all quantitation measurements. Record both concentration (ng/µl) and 260/280 ratio on your tube label. Accurate labeling and meticulous record-keeping are critical in all laboratory work, especially when dealing with precious metagenomic samples.
Why is it essential to record both concentration and purity on your tube labels, rather than just concentration?
Which of the following 260/280 ratios would typically indicate a pure dsDNA sample?
Imagine you’ve extracted DNA from a challenging environmental sample, and your NanoDrop results show a low 260/280 ratio (e.g., 1.5). Describe the potential implications for downstream metagenomic sequencing and what steps you might take to improve the sample’s purity.
Accurate DNA quantitation and purity assessment are non-negotiable steps that underpin the reliability and success of all subsequent metagenomic analyses.
In real-world metagenomics projects, knowing your DNA’s concentration and purity is critical for optimizing library preparation for sequencing. Too little DNA, or DNA laden with inhibitors, can lead to failed sequencing runs, wasted reagents, and significant delays. Proper quantitation ensures you load the correct amount of material, maximizing your chances of obtaining high-quality data.
The OD260 measurement provides critical insight into DNA concentration, while the 260/280 ratio serves as a vital indicator of sample purity, both of which are essential for successful downstream metagenomic applications.
Given the importance of both quantity and purity, what would be your immediate next step if your DNA sample showed a high concentration but a very low purity ratio?
Metagenomics Mini-Course — SLS Course Source Document
Page 25
The Shift
- Precise Quantitation: OD260 absorbance allows for accurate calculation of dsDNA concentration, ensuring sufficient material for experiments.
- Purity is Paramount: The 260/280 ratio is a quick, essential check for protein and phenol contamination, which can hinder downstream analyses.
- Quality Control is Key: Understanding and applying these quantitation and purity metrics with tools like NanoDrop is fundamental to the integrity and success of metagenomic research.