After successfully extracting DNA, how do scientists ensure it’s not only present but also of sufficient quantity and quality for critical downstream applications like sequencing or PCR?
You’ve meticulously followed the DNA extraction protocol, carefully isolating genetic material from your environmental sample. But simply having a tube of liquid isn’t enough. Before embarking on complex molecular biology techniques, two fundamental questions must be answered: how much DNA do we have, and is it clean enough to use?
These questions are simple, yet their answers are critical. Insufficient or contaminated DNA can lead to failed experiments, wasted reagents, and incorrect scientific conclusions. This lesson delves into the essential techniques used to quantify and assess the purity of extracted DNA, focusing on spectrophotometric analysis and the practical application of the Nanodrop system.
Why is it important to know both the quantity and purity of DNA before proceeding with further experiments?
The Science of Absorbance: Estimating DNA Concentration
The first step in assessing your extracted DNA is to determine its concentration. Scientists leverage a fundamental property of nucleic acids: their ability to absorb ultraviolet (UV) light. Specifically, DNA absorbs ultraviolet light strongly at 260 nanometers (nm).
This principle is harnessed by a scientific instrument called a spectrophotometer. By shining a beam of UV light through a tiny sample of your DNA solution and measuring how much light is absorbed at 260 nm (known as the optical density at 260 nm, or OD260), the spectrophotometer can accurately estimate the DNA concentration.
Spectrophotometry is an analytical method used to measure the concentration of a chemical substance by measuring the amount of light absorbed by the substance. For DNA, the optical density at 260 nanometers (OD260) is directly proportional to its concentration in a solution.
Want to go deeper? The Beer-Lambert Law
The relationship between absorbance and concentration is described by the Beer-Lambert Law: A = εcl, where:
Ais the measured absorbance.ε(epsilon) is the molar absorptivity coefficient, a constant specific to the substance (e.g., DNA) and wavelength.cis the concentration of the substance.lis the path length, the distance the light travels through the sample.
For double-stranded DNA (dsDNA) at 260 nm, a common conversion factor is used: an OD260 of 1.0 corresponds to approximately 50 micrograms per milliliter (µg/mL) when measured with a 1 cm path length. This simplifies calculations in the lab, allowing for quick estimations of DNA concentration.
Calculating DNA Concentration
Knowing the OD260 value, you can easily calculate the concentration of your double-stranded DNA (dsDNA). The standard conversion factor is:
For double-stranded DNA, an OD260 of 1.0 corresponds to about 50 micrograms per milliliter (µg/mL).
Let’s apply this to a practical example:
If your spectrophotometer measures an OD260 of 0.65 for your DNA sample, what is its concentration?
- Recall the conversion factor for dsDNA: 1.0 OD260 = 50 µg/mL.
- Multiply the measured OD260 by this conversion factor.
- Calculate the result.
Solution: 0.65 (OD260) × 50 µg/mL = 32.5 micrograms per milliliter (µg/mL).
If a double-stranded DNA sample yields an OD260 reading of 0.85, what is its estimated concentration?
Purity Matters: The OD260/OD280 Ratio
Concentration is only half the story. Even if you have a high concentration of DNA, it may not be suitable for your experiments if it’s contaminated. Purity matters because contaminants can distort concentration readings and interfere with downstream reactions such as PCR, sequencing, or cloning.
Common contaminants in DNA extractions include proteins, phenols, and guanidine salts, which are often carried over from the extraction reagents. Proteins, in particular, absorb UV light strongly at 280 nanometers (nm).
To assess purity, scientists use the OD260 to OD280 ratio. This ratio gives a quick and reliable indicator of protein contamination:
- Pure DNA is usually near 1.8.
- Pure RNA is closer to 2.0.
A ratio significantly lower than 1.8 indicates substantial protein contamination, while a ratio significantly higher than 2.0 might suggest RNA contamination or residual phenol.
The ratio of absorbance at 260 nm to 280 nm (OD260/OD280) is a key indicator of nucleic acid purity. A ratio of ~1.8 is generally accepted for pure DNA, while ~2.0 indicates pure RNA. Deviations suggest contamination by proteins or other organic compounds.
Other contaminants can also affect DNA purity. For example, carbohydrates can absorb at 230 nm, leading to an OD260/OD230 ratio that provides additional purity insights. An ideal OD260/OD230 ratio is typically between 2.0 and 2.2.
A high DNA concentration reading guarantees a usable sample for all molecular biology applications.
While concentration is important, DNA purity is equally critical. A high concentration of impure DNA can be detrimental to downstream experiments, as contaminants interfere with enzymatic reactions and distort results.
- DNA concentration is estimated by measuring absorbance at 260 nm (OD260).
- For dsDNA, an OD260 of 1.0 corresponds to 50 µg/mL.
- DNA purity is assessed by the OD260/OD280 ratio, with ~1.8 indicating pure DNA.
- Contaminants can significantly impact experimental success.
How might a protein-contaminated DNA sample (e.g., with an OD260/OD280 ratio of 1.2) impact a subsequent PCR experiment?
The Nanodrop Workflow: Precision with Minimal Sample
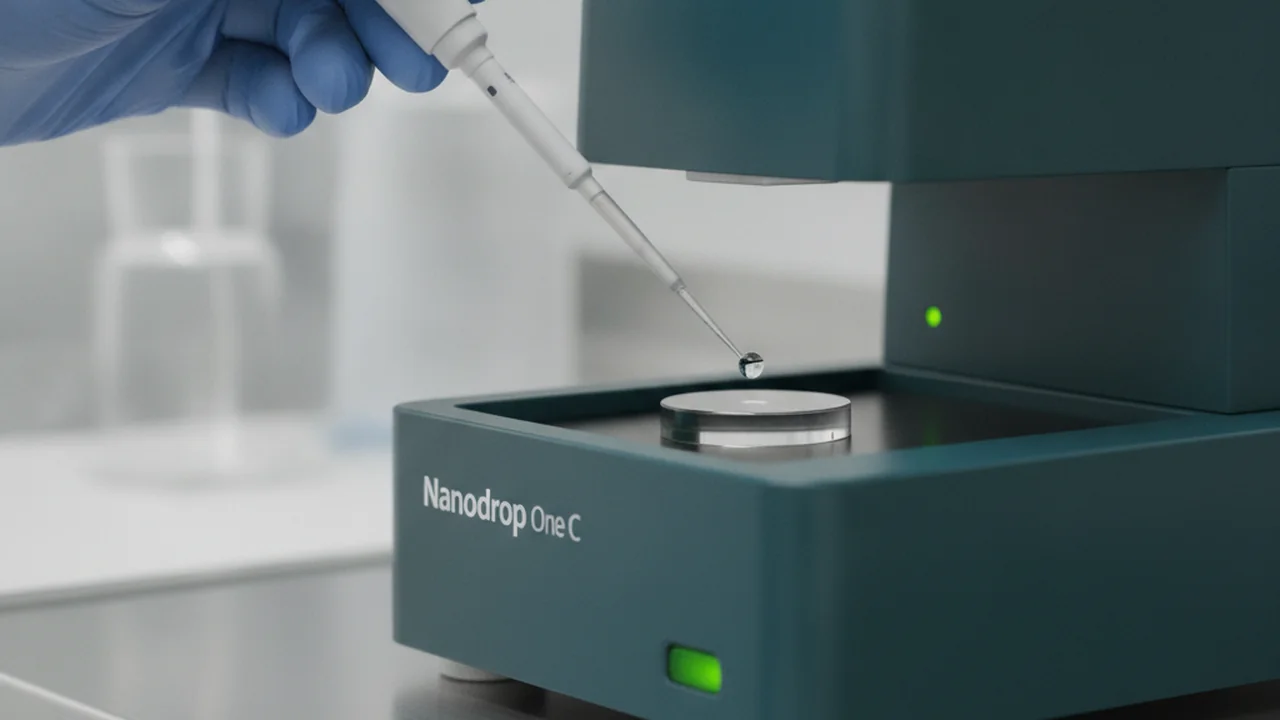
In modern molecular biology labs, the Nanodrop spectrophotometer has become an indispensable tool for DNA quantitation and purity assessment. Its key advantage is its ability to measure samples with extremely small volumes – typically just one microliter.
The Nanodrop workflow is straightforward and efficient:
- A minute sample volume (e.g., 1 µL) is pipetted directly onto a measurement pedestal.
- A movable arm lowers, creating a liquid bridge between two optical fibers.
- The instrument measures the absorbance at various wavelengths (including 260 nm and 280 nm) without the need for cuvettes or dilutions.
- A result screen instantly displays the DNA concentration (in µg/mL or ng/µL) and the OD260/OD280 purity ratio, often as a stylized dashboard.
After obtaining these critical measurements, a common laboratory practice is to write the DNA concentration and 260/280 ratio directly on the tube containing the DNA. This ensures that essential information is readily available for all subsequent experiments.
The Nanodrop’s ability to use minimal sample volumes is revolutionary for metagenomics. When working with precious or low-yield environmental DNA extractions, every microliter counts. This instrument allows researchers to quantify DNA without significant sample loss, preserving more material for downstream applications like whole-genome sequencing.
Which of the following is a primary advantage of using a Nanodrop spectrophotometer for DNA quantitation?
Imagine you’ve just extracted DNA from a challenging soil sample, and your Nanodrop results show an OD260 of 0.40 and an OD260/OD280 ratio of 1.4. Describe what these results indicate and what your next steps might be to prepare this DNA for a sequencing project.
Purity matters because contaminants can distort concentration readings and interfere with reactions.
With precise quantitation and purity assessment in hand, your DNA sample is one step closer to being ready for the next phase of molecular biology. But even with good concentration and purity, there’s one more critical hurdle: are there any remaining inhibitors?
Once the DNA is quantified, the next test asks whether the extraction removed inhibitors well enough for molecular biology to work. This final check ensures that your hard-won DNA is truly prepared for the complex enzymatic processes that drive metagenomic discovery.
Accurate DNA quantitation and purity assessment using spectrophotometric methods like Nanodrop analysis are indispensable prerequisites for successful and reliable molecular biology experiments in metagenomics.
The Shift
- Understanding DNA concentration via OD260 is fundamental for knowing how much genetic material you have.
- Assessing DNA purity through the OD260/OD280 ratio is equally critical, as contaminants can compromise downstream reactions.
- Tools like the Nanodrop enable rapid, precise DNA quantitation and purity checks with minimal sample volume, streamlining metagenomics workflows.