How do scientists make the invisible world of DNA visible, and verify that their molecular experiments are proceeding as expected?
Imagine you’ve successfully completed a Polymerase Chain Reaction (PCR), amplifying a specific segment of DNA. You have a tube filled with millions of copies of your target DNA, yet to the naked eye, it’s just a clear liquid. How can you be sure your amplification worked? More importantly, how can you confirm that you’ve amplified the correct size of DNA?
This is where Agarose Gel Electrophoresis becomes an indispensable tool in molecular biology. It’s the critical step that allows us to separate DNA fragments by size and visually confirm the presence of our expected product. For our metagenomics workflow, this means verifying our 300 base pair (bp) PCR product before moving on to more complex library preparation for sequencing.
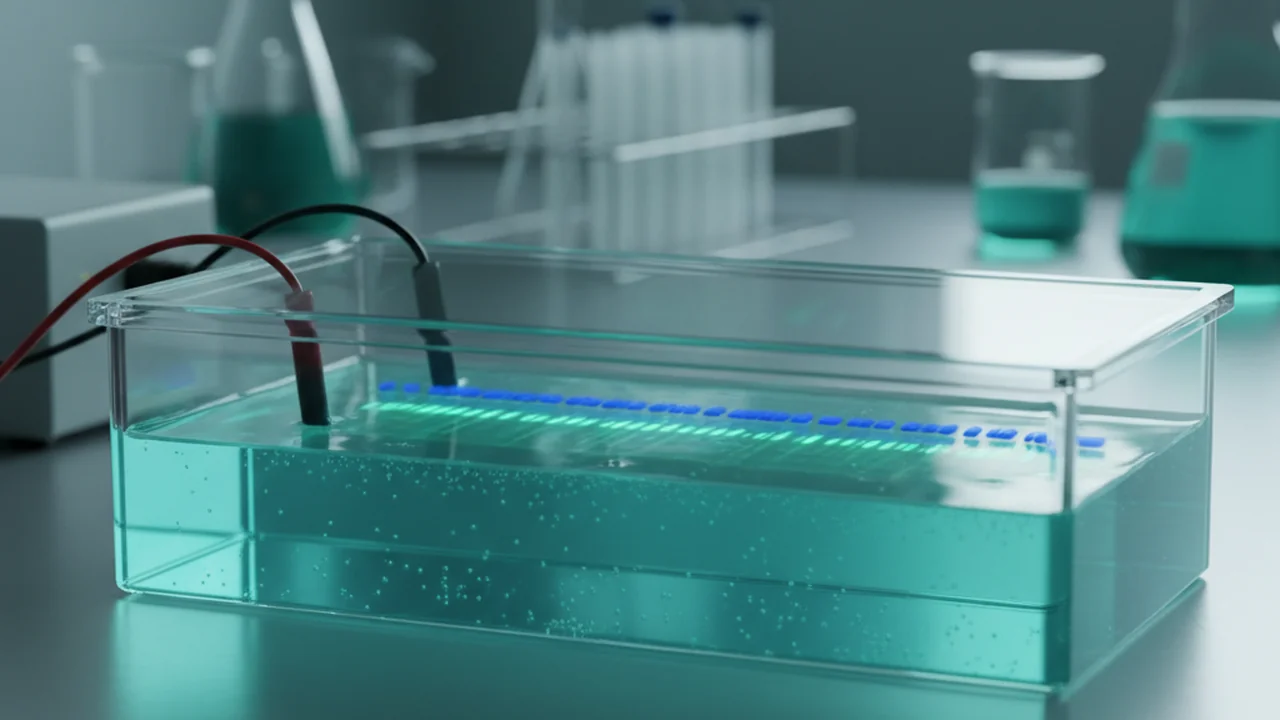
Agarose gel electrophoresis lets us separate DNA by size and visualize whether the expected band is present.
Preparing the Agarose Gel
The first step in visualizing our PCR product is to prepare the agarose gel itself. This gel acts as a molecular sieve, allowing smaller DNA fragments to move through it more easily than larger ones.
Calculating the Agarose Concentration
The concentration of agarose in the gel determines how effectively it separates DNA fragments of different sizes. A higher percentage gel is better for separating smaller fragments, while a lower percentage gel works better for larger fragments. For our 300 base pair PCR product, a 2% agarose gel is suitable.
Expressed as a percentage (w/v), it indicates the grams of agarose per 100 milliliters of solution. For example, a 2% agarose gel means 2 grams of agarose per 100 milliliters of buffer.
To make a 2% agarose gel in 50 milliliters of buffer, we perform a simple calculation:
- A two percent agarose gel means two grams per one hundred milliliters.
- For fifty milliliters, the amount is half of that: one gram of agarose.
Imagine your lab needs a 1.5% agarose gel, and your casting tray requires 75 milliliters of solution. How much agarose would you need?
- Recall the definition of agarose gel concentration.
- Set up the proportion: 1.5g / 100ml = Xg / 75ml.
- Solve for X.
Pouring the Gel
Once the agarose is weighed, it’s mixed with a buffer solution, typically TAE (Tris-Acetate-EDTA). This buffer helps maintain a stable pH during electrophoresis and provides ions to conduct electricity.
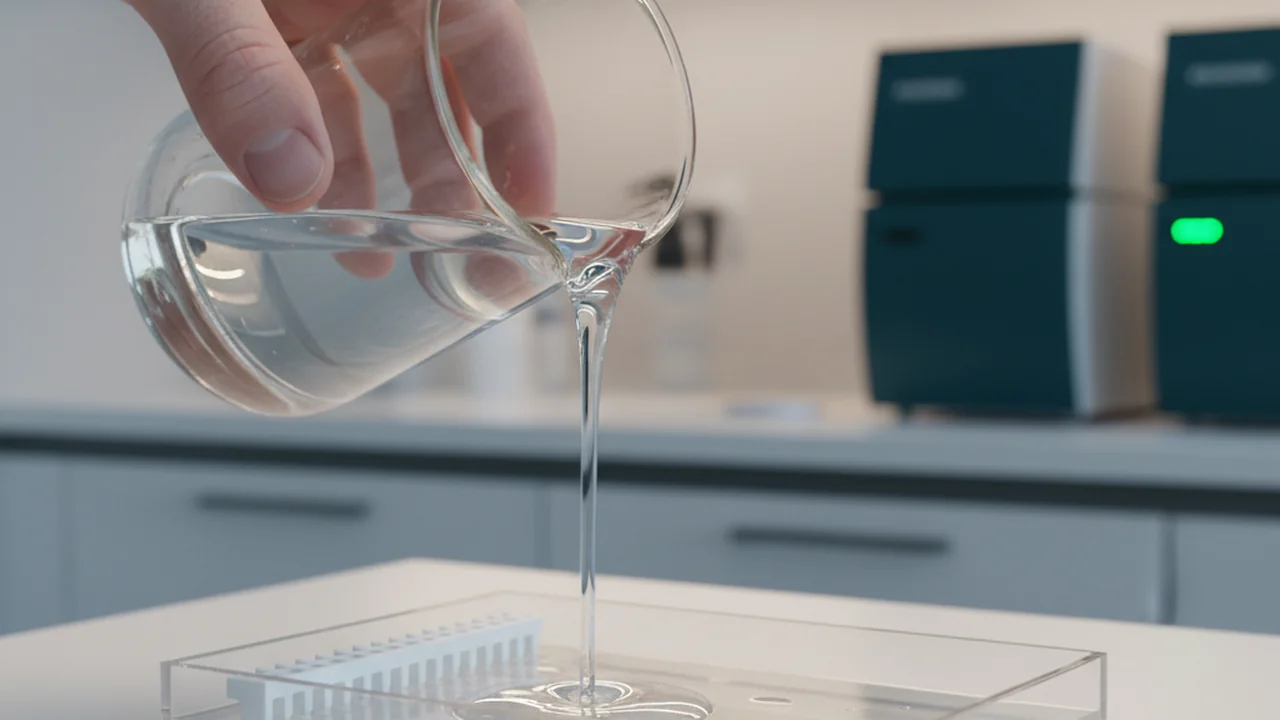
The gel is made by dissolving agarose in TAE buffer, adding DNA stain after cooling, pouring the liquid into a casting tray, and inserting a comb to form wells. The DNA stain, such as SYBR Safe, intercalates with the DNA and fluoresces under UV light, allowing us to see the DNA bands.
Consider the importance of precision in weighing and measuring reagents. How might small errors affect the outcome of your gel electrophoresis?
- Agarose gel electrophoresis separates DNA by size.
- Gel concentration is calculated as grams per 100 ml.
- Gel preparation involves mixing agarose with buffer, heating, cooling, staining, and pouring into a mold.
Loading and Running the Gel
After the agarose gel solidifies, it’s ready for sample loading and electrophoresis.
Loading the Samples
The solidified gel is carefully placed into an electrophoresis running box, which is then filled with TAE buffer, ensuring the gel is fully submerged. The comb, which created the wells, is gently removed, leaving behind small depressions where the DNA samples will be loaded.
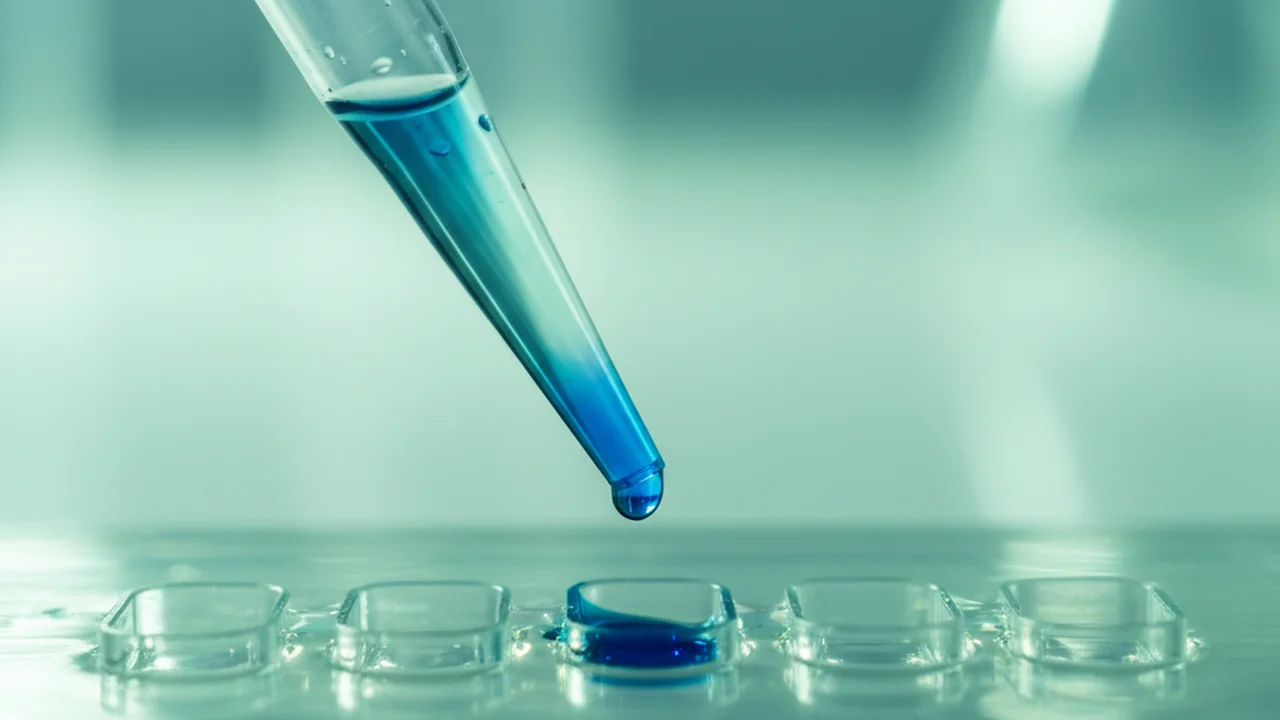
A DNA ladder (also known as a marker) is loaded into the far-left well. This ladder contains DNA fragments of known sizes, serving as a reference to determine the size of our experimental PCR products. Following the ladder, the PCR samples are loaded left to right into the remaining wells.
Loading dye, often mixed with your DNA samples before loading, contains a dense glycerol component that helps the sample sink into the well. It also contains colored tracking dyes that migrate through the gel, allowing you to visually monitor the progress of electrophoresis without affecting the DNA.
Running the Gel
Once all samples are loaded, the lid is placed on the running box, and an electric current is applied. DNA molecules carry a net negative charge due to their phosphate backbone. This negative charge causes them to migrate towards the positive electrode (anode) when an electric field is applied.
An electric field pulls negatively charged DNA toward the positive electrode. The agarose mesh slows large fragments and lets small ones travel farther.
DNA moves through the gel because it’s pulled by the electric current, and its movement speed is solely determined by the voltage.
DNA is negatively charged and actively repelled by the negative electrode, moving towards the positive electrode. Its movement speed is determined by size (smaller moves faster), the gel’s concentration, and the applied voltage.
As DNA moves through the porous agarose matrix, it encounters resistance. Smaller fragments can navigate these pores more easily and thus travel faster and farther through the gel than larger fragments. This differential migration is the basis of separation by size.
How does the concept of “molecular sieving” apply to the separation of DNA fragments in an agarose gel?
The rate at which DNA moves through an agarose gel is influenced by several factors: the molecular size of the DNA, the agarose concentration, the conformation of the DNA (e.g., supercoiled, relaxed, linear), the voltage applied, and the type of buffer used. The gel’s pores act like a mesh, and the DNA “snakes” its way through. This phenomenon is known as reptation. Higher voltage can speed up migration but can also generate more heat, potentially melting the gel or denaturing the DNA if not properly controlled.
What is the primary factor that causes DNA fragments to separate by size during agarose gel electrophoresis?
Interpreting the Gel Results
After the electrophoresis run is complete, the gel is typically viewed under UV light to visualize the stained DNA bands.

The ladder provides size reference points, allowing us to estimate the size of our sample DNA. For this PCR test, we look for a sample band near the 300 base pair marker. A clear band near that position suggests the DNA extraction produced PCR-compatible DNA, and our amplification was successful.
Agarose gel electrophoresis is a fundamental technique in molecular biology that allows for the visualization and size-verification of DNA fragments, ensuring the success of upstream processes like PCR before proceeding to downstream applications.
Beyond simply verifying PCR products, agarose gel electrophoresis is used in various applications such as DNA fingerprinting in forensics, analyzing restriction enzyme digests, separating plasmids, and even for purifying DNA fragments for cloning.
If you are looking for a 300 base pair PCR product, what would a successful agarose gel result show?
Bridge to Library Preparation
With the successful visualization of our 300 bp PCR product on the agarose gel, we’ve confirmed that our amplification step worked. This is a crucial checkpoint in the metagenomics workflow. Once amplification works, the sample is ready to move toward library preparation for sequencing.
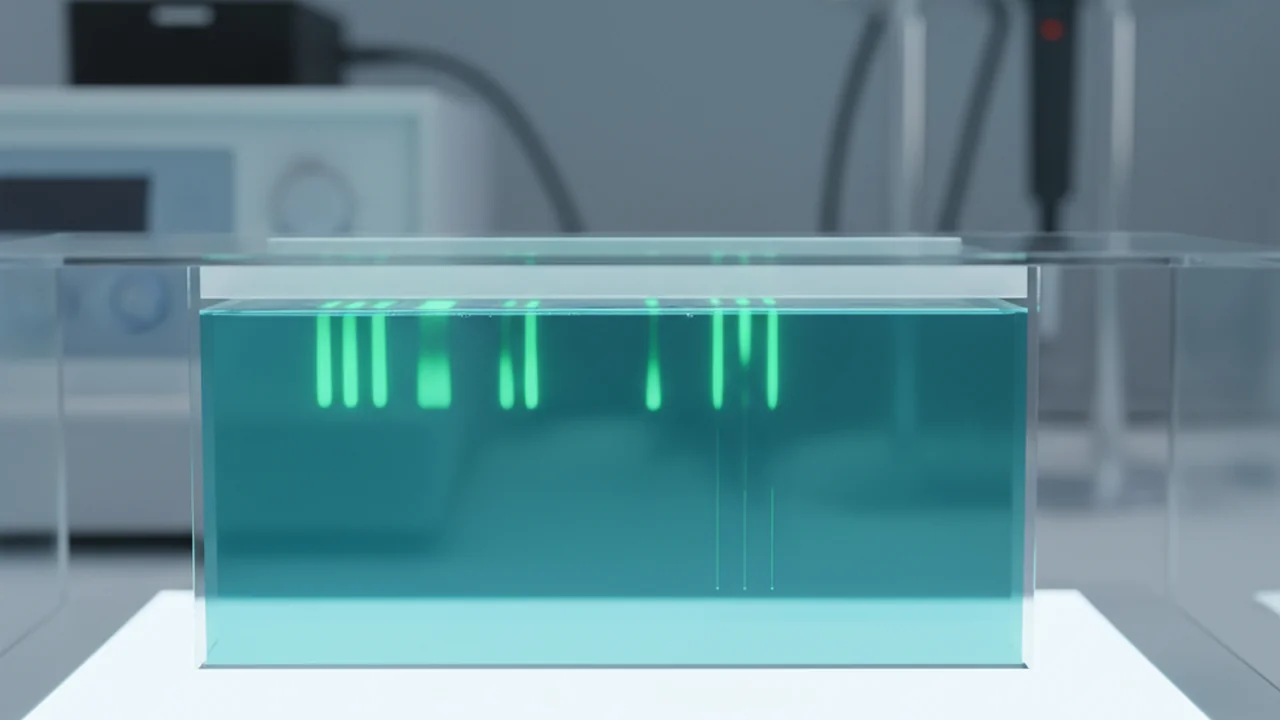
Library preparation involves adding specific adapters to the DNA fragments, which are essential for binding to the sequencing platform and allowing the sequencing reaction to proceed. The accuracy of our PCR and the successful verification on the gel directly impact the quality and reliability of the subsequent sequencing data.
Reflect on the importance of each step in the agarose gel electrophoresis protocol. If one step were performed incorrectly (e.g., incorrect agarose concentration, forgetting the DNA stain, loading errors), how might that impact the final interpretation of your results, and what downstream consequences could it have for a metagenomics project?
The Shift
- Agarose gel electrophoresis is a crucial technique for visualizing and separating DNA fragments by size, enabling scientists to confirm the success of molecular reactions like PCR.
- The process involves preparing an agarose gel of a specific concentration, loading DNA samples alongside a size ladder, running an electric current, and interpreting the resulting bands under UV light.
- Successfully visualizing the expected DNA band on a gel provides essential verification, allowing researchers to confidently proceed to subsequent steps in complex workflows such as library preparation for metagenomic sequencing.