How do raw, unreadable signals from a DNA sequencer transform into meaningful biological insights about an entire ecosystem?
Imagine you’ve collected samples from a mysterious environment, extracted the DNA of countless microbes, and run it through a powerful sequencing machine. You now have a torrent of raw data – electrical signals, squiggly lines, or complex digital files. But how do you get from this raw output to understanding the hidden life within your sample? This is where bioinformatics comes in.
Bioinformatics is the essential bridge, the crucial process of converting raw sequencing signals into interpretable biological evidence. Without it, even the most advanced sequencing technology would yield nothing but incomprehensible noise.
The interdisciplinary field that develops methods and software tools for understanding biological data, especially when the data sets are large and complex. In metagenomics, it is used to process raw sequencing reads into meaningful biological insights.
Consider the sheer volume of data a single sequencing run can generate. Why is a systematic computational approach absolutely necessary to make sense of it?
The Bioinformatics Workflow: From Raw Signal to Insight
The journey from raw sequencer output to biological discovery is a multi-step bioinformatics workflow. Let’s explore each critical stage.
Data Begins: The Raw Signal
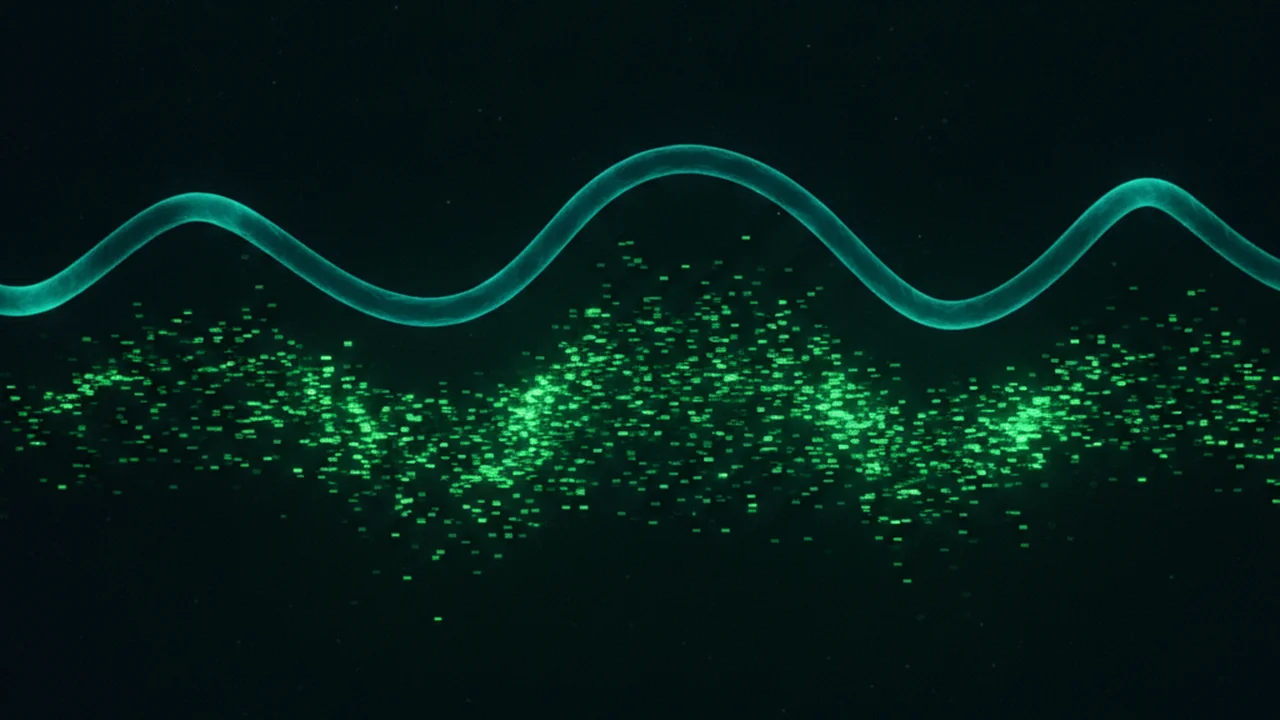
The moment DNA passes through a nanopore sequencer, it generates a unique electrical signal. This raw signal is the very first form of data, a continuous stream representing the passage of different DNA bases.
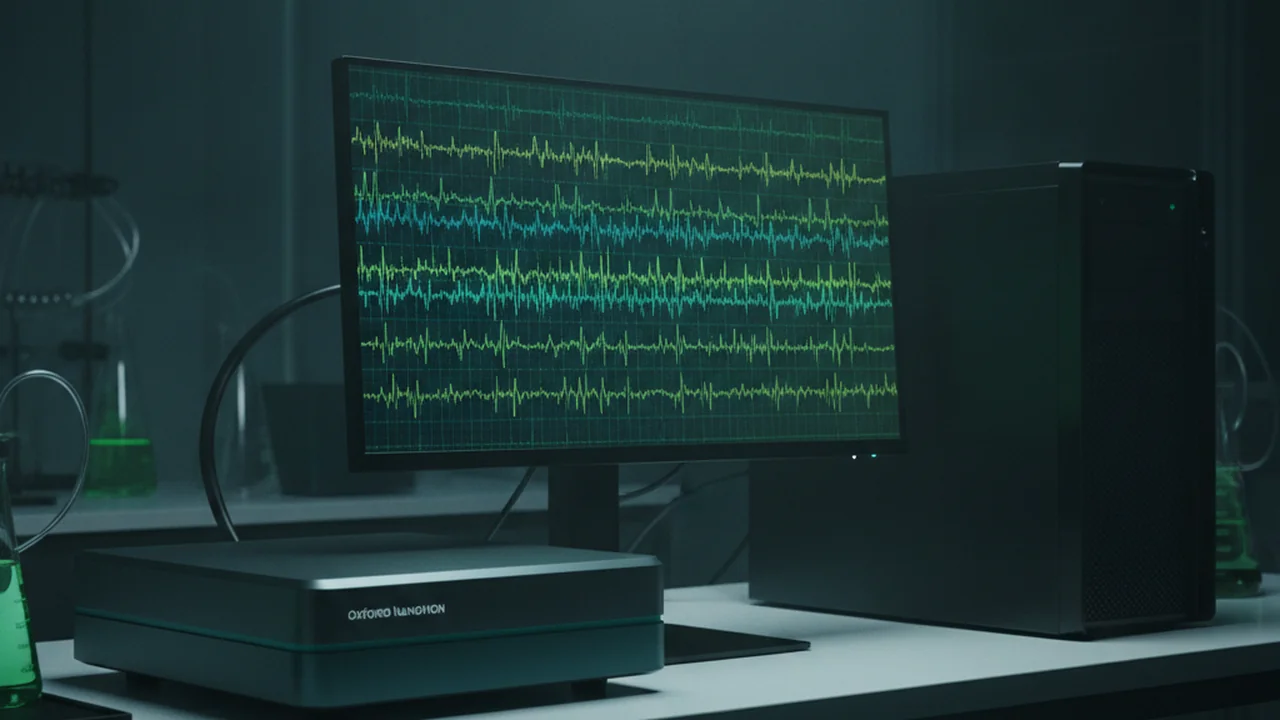
At this stage, the data is just that: data. It holds immense potential, but it is not yet interpretable biological evidence. It’s the starting point for all subsequent analysis.
Once DNA is sequenced, you immediately have biological answers, like a complete list of species or genes.
Sequencing produces raw data—electrical signals or digital files—that require extensive bioinformatics processing to be converted into interpretable biological evidence and insights.
Basecalling: Translating Squiggles to Sequences
The first major step in making sense of the raw electrical signal is basecalling. This is where specialized software interprets the minute changes in the electrical current as specific DNA bases (A, T, C, G).
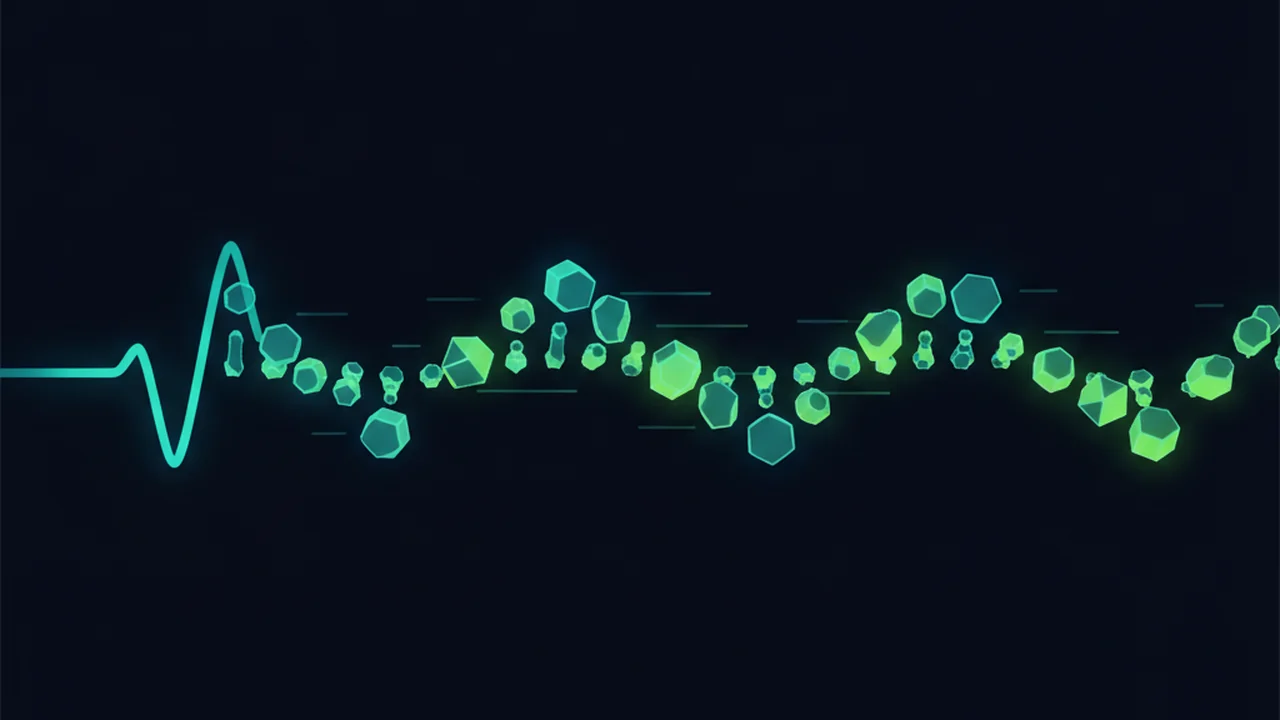
Each distinct squiggle waveform corresponds to a particular nucleotide passing through the nanopore. Basecalling algorithms are highly sophisticated, using complex models to accurately assign bases, even accounting for potential errors or ambiguities in the signal.
Want to go deeper? The algorithms behind basecalling
Modern basecalling often employs advanced machine learning techniques, particularly recurrent neural networks. These networks are trained on vast datasets of known DNA sequences and their corresponding electrical signals. This allows them to learn the intricate patterns that differentiate each base, and even detect modified bases or structural variations, improving accuracy significantly over older statistical methods.
The challenge lies in the inherent ‘noise’ of biological signals and the speed at which DNA passes through the pore. Continuous improvement in algorithms is crucial for maximizing the accuracy and throughput of nanopore sequencing.
Demultiplexing: Sorting Samples
In many metagenomic experiments, multiple samples are pooled together and sequenced simultaneously to save time and cost. Before pooling, each sample is tagged with a unique short DNA sequence called a barcode. After basecalling, the software must then perform demultiplexing.
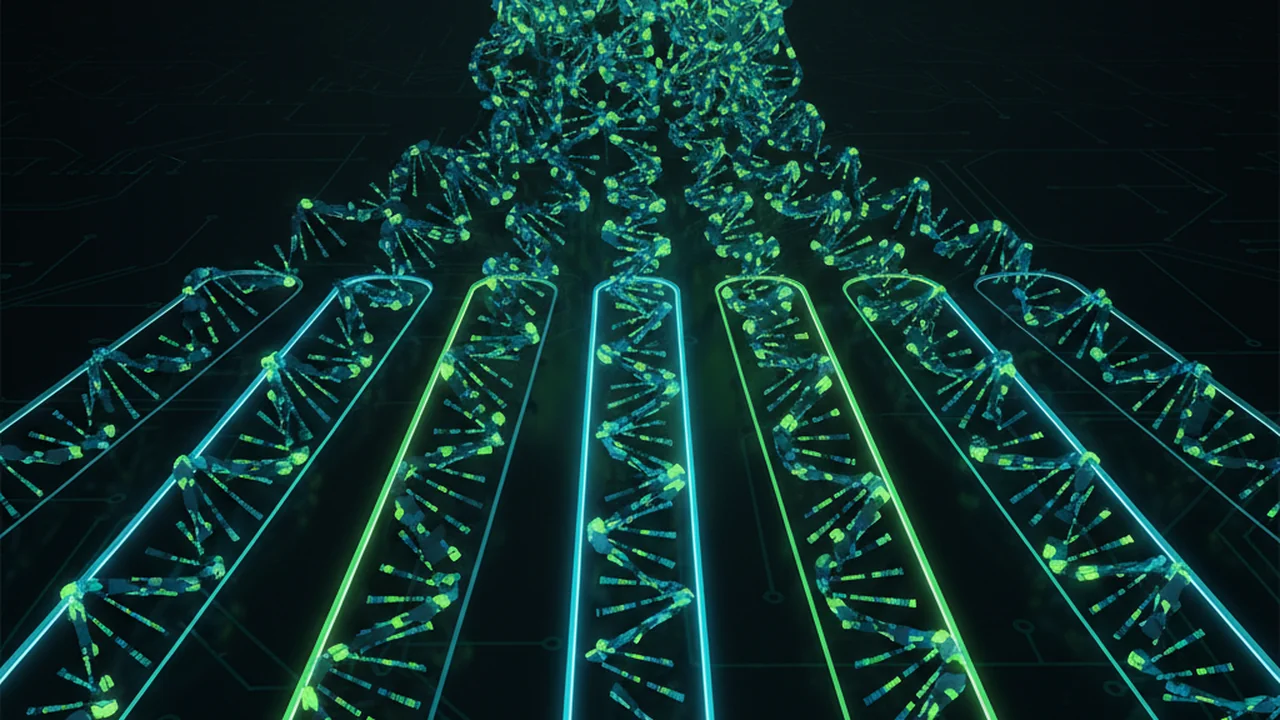
Demultiplexing identifies these barcodes within the sequence reads and sorts them back into their original, individual samples. This ensures that the data from each environmental or biological sample remains distinct, preventing cross-contamination of results.
Imagine you have three samples (A, B, C) and you’ve designed unique 4-base-pair barcodes for each: Sample A = ATCG, Sample B = CGTA, Sample C = GCTA. After sequencing and basecalling, you get the following reads (barcodes are at the start):
- ATCG-GATCCA…
- CGTA-TTAGGC…
- GCTA-CCGGAT…
- ATCG-TTGGCA…
- CGTA-AGCTAG…
If a read comes in as “GCTA-AATTCC…”, to which sample would it be demultiplexed? Why is it important that barcodes are unique and ideally have some sequence differences to minimize errors?
- Raw sequencing signals must be converted into DNA sequences through basecalling.
- Demultiplexing uses unique barcodes to sort reads back to their original samples.
FASTQ Processing: Quality Control is Key
Once basecalled and demultiplexed, sequence reads are commonly stored in FASTQ files. These files are crucial because they contain not only the DNA sequence itself but also a corresponding quality score for each base.
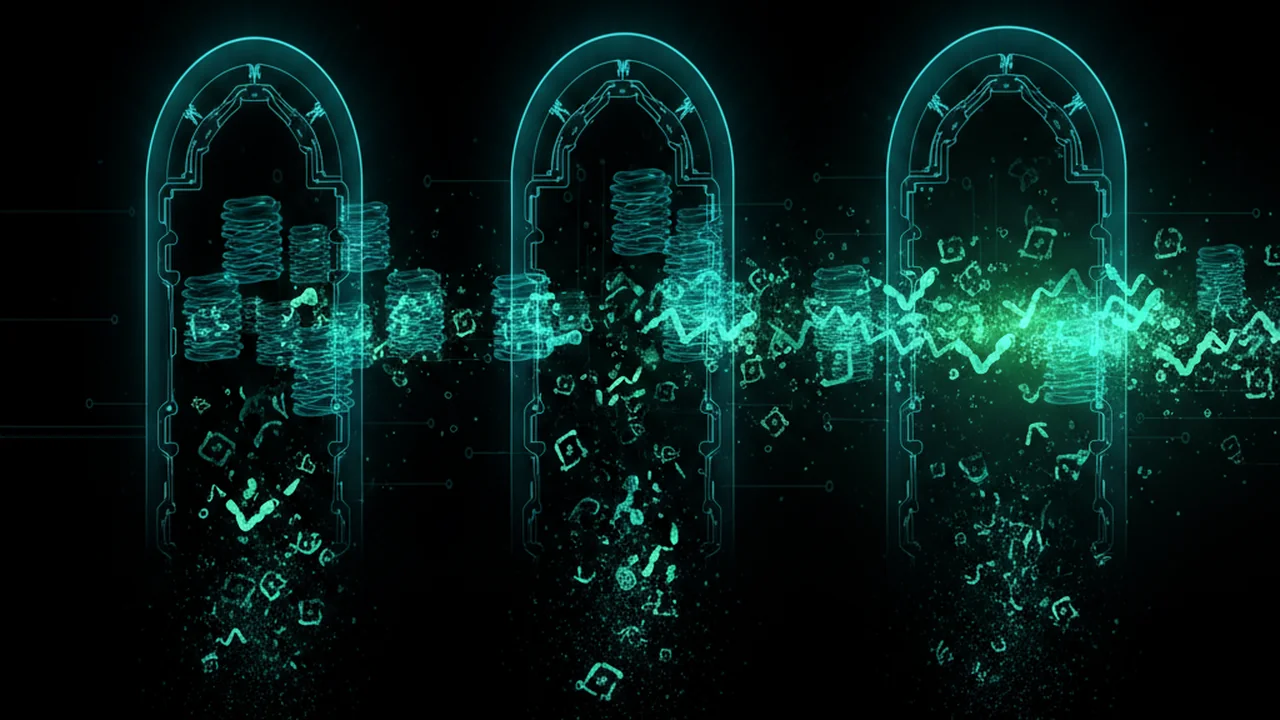
Quality control is a critical step here. Low-quality reads, which might have high error rates due to sequencing artifacts or poor signal, are identified and removed. This filtering process ensures that only reliable, high-quality data proceeds to downstream analysis, preventing misleading results.
A single run on a high-throughput sequencer can generate terabytes of raw data. Processing this volume requires significant computational power, including multi-core processors, large amounts of RAM, and often cloud-based computing resources, highlighting the ‘big data’ challenge inherent in modern genomics.
A text-based format for storing both a DNA or RNA sequence and its corresponding quality scores. Each base in the sequence has an associated quality score, indicating the probability of an incorrect base call.
Why is it more beneficial to remove low-quality reads entirely rather than trying to ‘correct’ them?
Alignment and Assembly: Building the Bigger Picture
With high-quality reads in hand, the next phase involves piecing together the genetic puzzle. Depending on the research goal, there are two primary approaches:
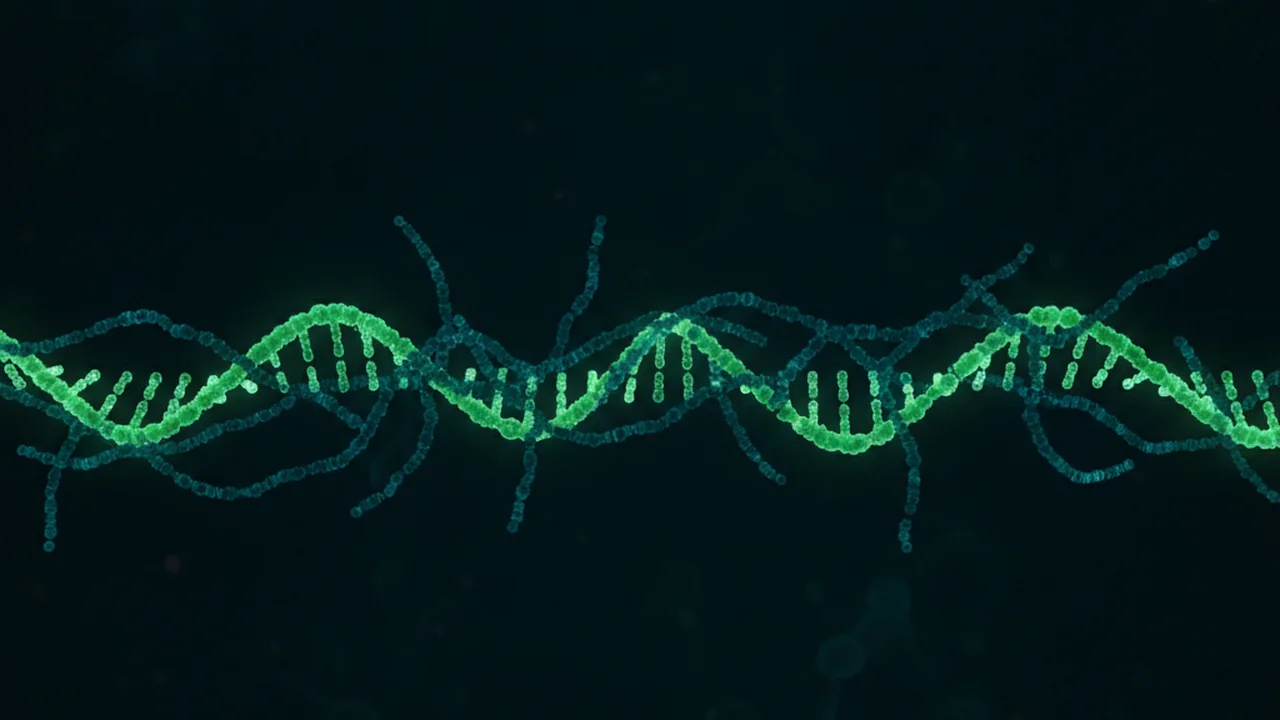
Alignment involves mapping your sequenced reads to a known reference genome. This is useful if you expect to find organisms with existing genome sequences, allowing you to identify species, detect genetic variations, or quantify gene expression.
Assembly, on the other hand, is used when no suitable reference genome exists. Software algorithms take the short reads, identify overlapping regions, and stitch them together to reconstruct longer, continuous sequences called contigs. This “de novo” assembly is crucial for discovering novel genes or even entirely new microbial genomes from environmental samples.
Both approaches ultimately help reveal what organisms or genes may be present in your sample, providing a foundational understanding of its biological composition.
Reflect on the difference between alignment and assembly. In what specific research scenarios would you prioritize one over the other in a metagenomics study?
EPI2ME and Downstream Tools: Interpreting Metagenomic Data
Once you have aligned or assembled sequences, the real biological interpretation begins. Platforms like Oxford Nanopore Technologies’ EPI2ME provide user-friendly interfaces to streamline these complex analyses.
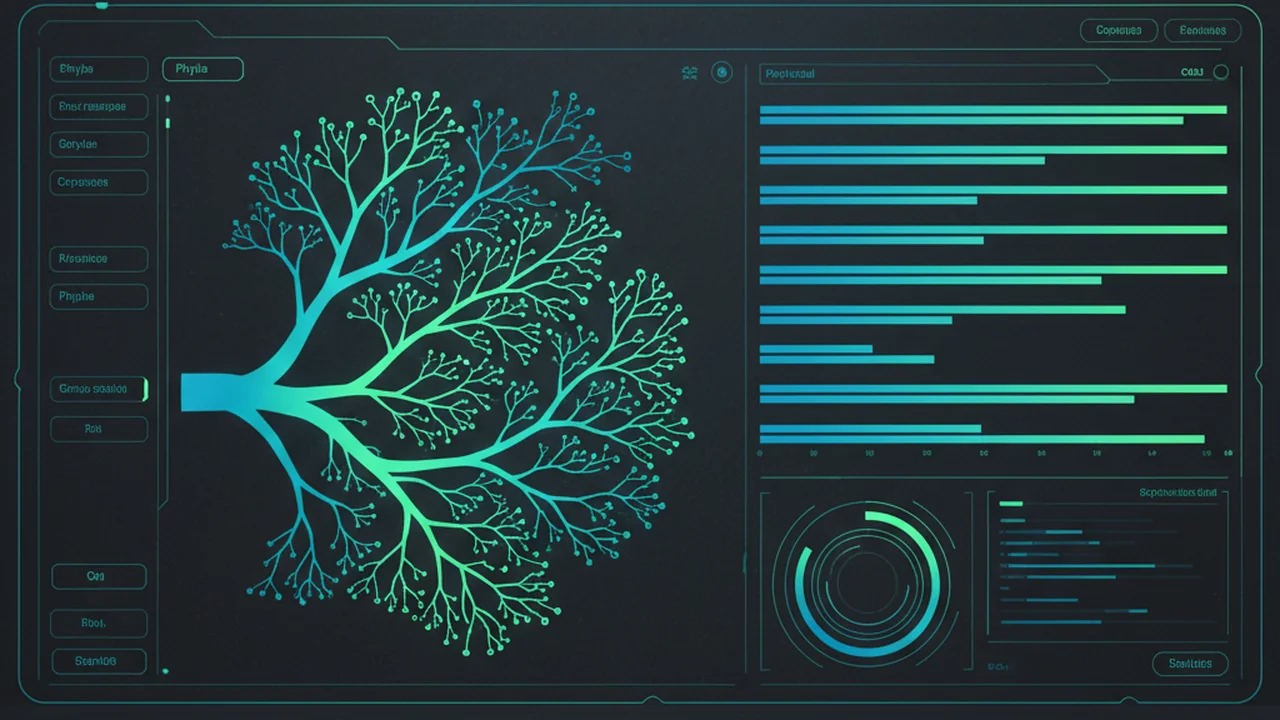
These downstream analyses can involve a variety of steps:
- Database searches: Comparing your sequences against vast public databases (like NCBI or MGnify) to identify known genes, proteins, or organisms.
- Resistance markers: Screening for genes associated with antibiotic resistance, crucial in clinical or environmental health studies.
- Phylogenetic relationships: Constructing evolutionary trees to understand how different microbial species are related.
- Functional interpretation: Predicting the metabolic pathways and ecological roles of the microbes based on their gene content.
These tools support comprehensive workflows for identifying organisms and interpreting metagenomic data, moving beyond just sequences to actual biological meaning.
The speed and portability of nanopore sequencing, combined with integrated bioinformatics platforms like EPI2ME, are transforming pathogen surveillance. Researchers can sequence samples directly in the field or at the point of care, rapidly identifying infectious agents and tracking antimicrobial resistance in real-time during outbreaks.
Which of the following is the primary purpose of demultiplexing in a metagenomics workflow?
Scientific Interpretation: Connecting Data to the Field
The final and arguably most crucial step in any metagenomics project is not just reading a chart or a phylogenetic tree. It is connecting the data back to the sampling site, the original research question, and the environmental conditions that may explain the results.
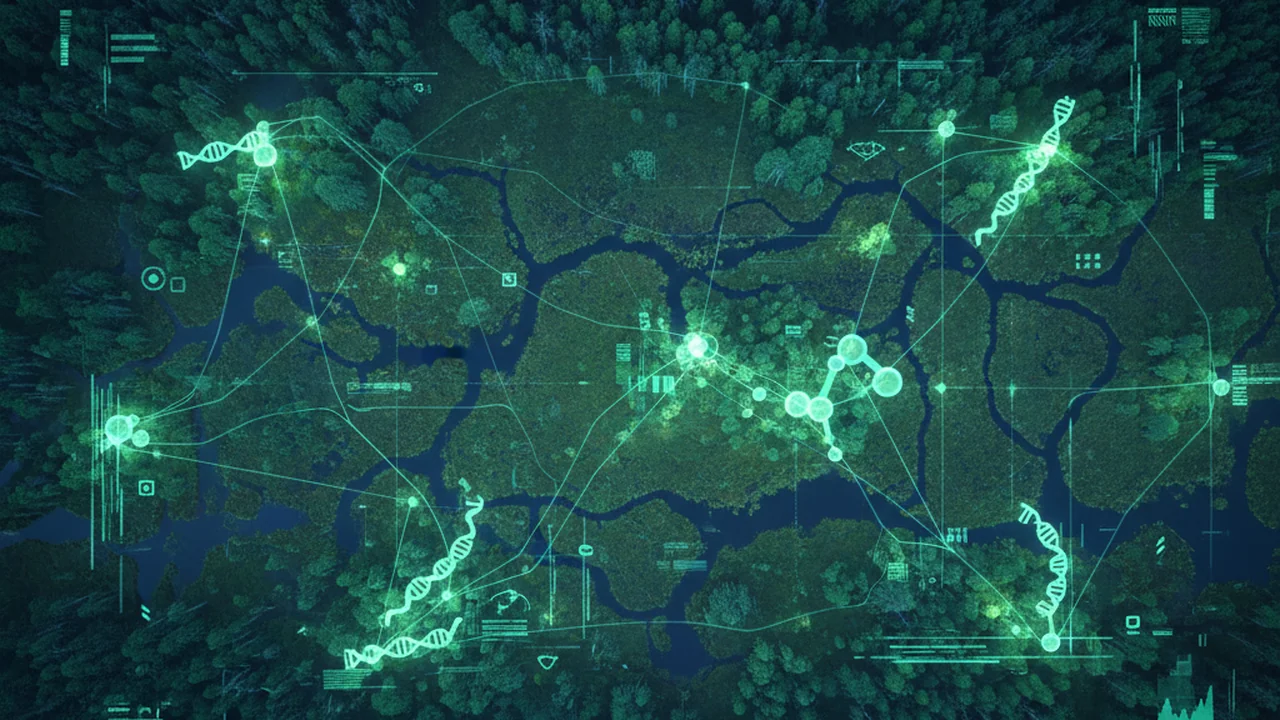
This means asking: What do these identified organisms tell us about the ecosystem? How do the predicted functions of their genes relate to the observed conditions? Are there unexpected findings that challenge our initial hypotheses? This holistic interpretation transforms raw data into genuine biological insight and contributes to our understanding of the natural world.
The final step is not just reading a chart. It is connecting the data back to the sampling site, the original question, and the environmental conditions that may explain the results.
Why is it critical for bioinformaticians to understand the ecological context of the samples they are analyzing, beyond just the computational aspects?
The Full Metagenomics Journey: A Holistic View
Metagenomics is a truly interdisciplinary field that seamlessly brings together diverse scientific domains. From the initial conceptualization of a project to its final interpretation, it encompasses:
- Field science: Site selection, sample collection, and understanding environmental context.
- Molecular biology: DNA extraction, PCR, library preparation, and sequencing.
- Sequencing technology: Operating advanced instruments like nanopore sequencers.
- Computation (Bioinformatics): Data processing, analysis, and interpretation.
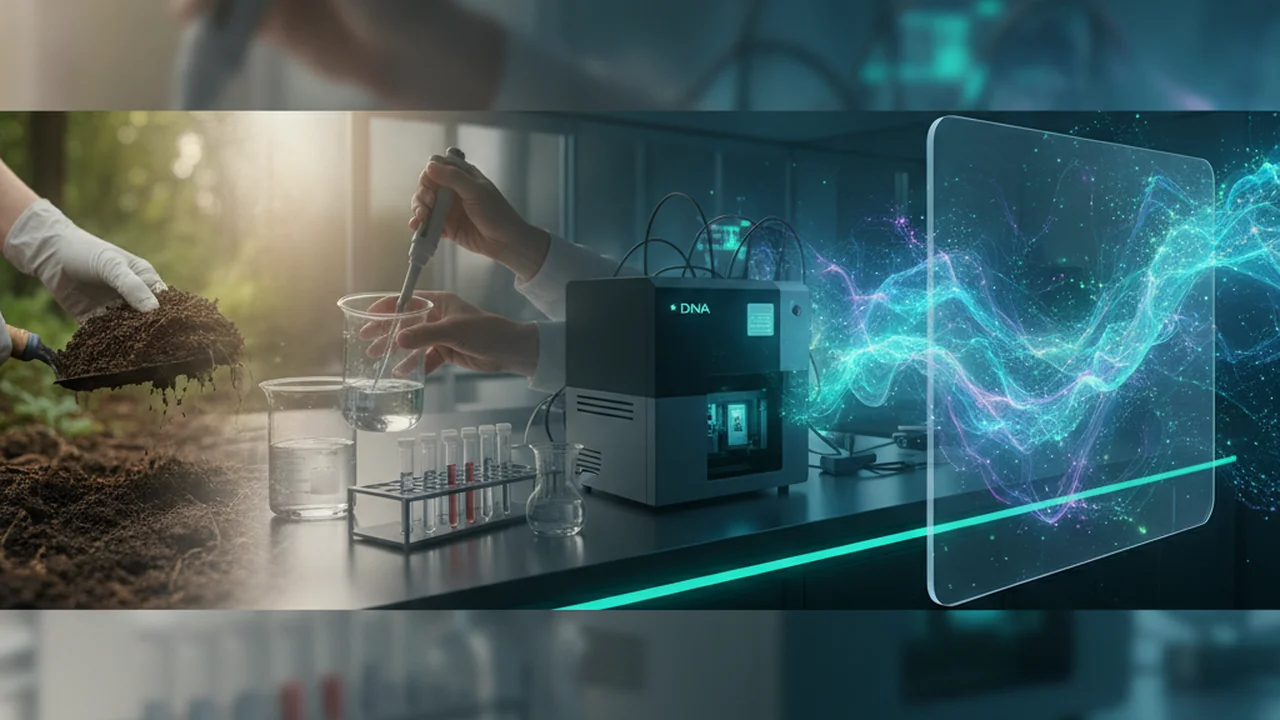
It turns a local sample into a window on an invisible ecosystem, revealing the intricate microbial communities that shape our world. This powerful approach allows us to explore microbial diversity, discover novel genes, and understand ecological processes at an unprecedented scale.
Which of the following is NOT typically considered a core component brought together by metagenomics?
Bioinformatics is an indispensable, multi-step process that transforms raw sequencing data into actionable biological insights, bridging the gap between molecular biology and ecological understanding.
The Shift
- You now understand that raw sequencing data is not immediately interpretable; it requires a sophisticated bioinformatics pipeline.
- You can identify the key steps in a metagenomics bioinformatics workflow, from basecalling and demultiplexing to quality control, alignment/assembly, and downstream analysis.
- You appreciate how bioinformatics connects molecular data back to the real-world ecological context, enabling deeper scientific interpretation.